Thư Viện Tiếng Anh
Thư viện tài liệu tiếng Anh miễn phí
Subject: Graphing Data
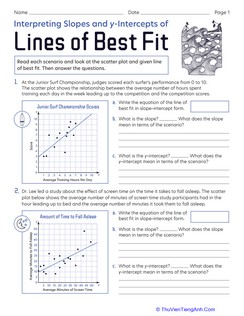
Interpreting Slopes and y-Intercepts of Lines of Best Fit
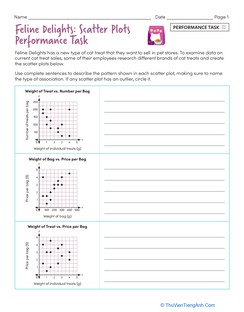
Feline Delights: Scatter Plots Performance Task
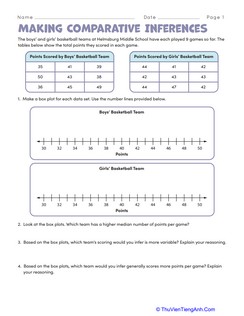
Making Comparative Inferences
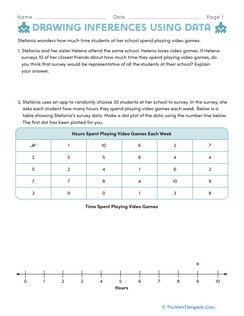
Drawing Inferences Using Data
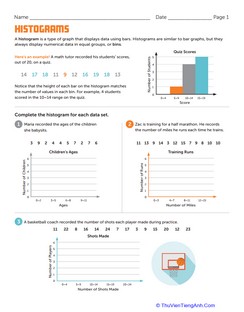
Histograms
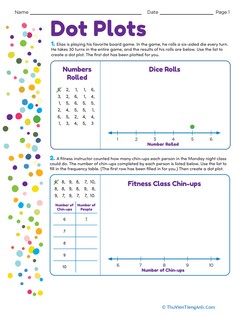
Dot Plots
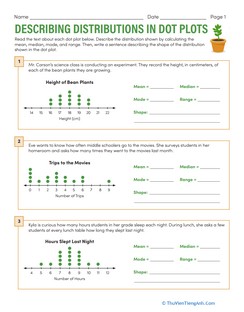
Describing Distributions in Dot Plots
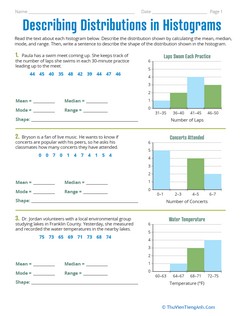
Describing Distributions in Histograms
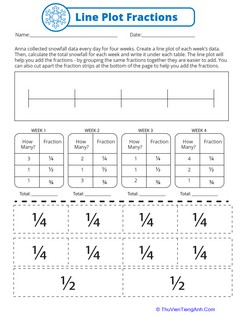
Line Plot Fractions
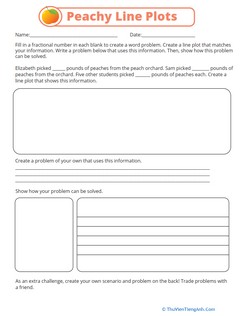
Peachy Line Plots
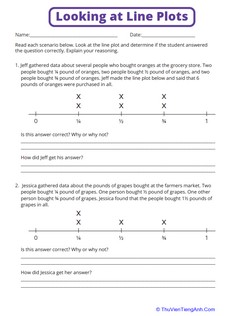
Looking at Line Plots
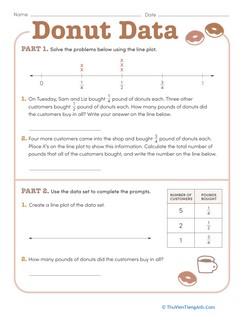
Donut Data
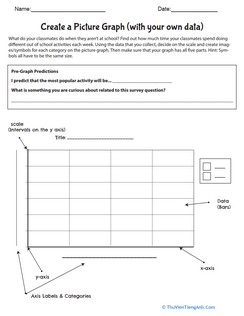
Create a Picture Graph (with your own data)
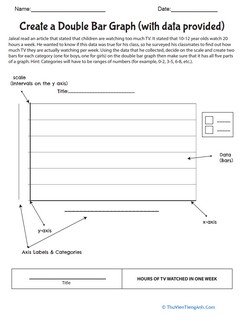
Create a Double Bar Graph (with data provided)
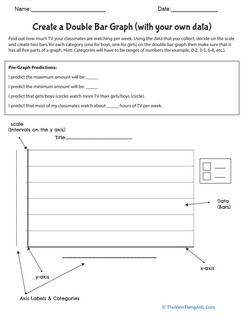
Create a Double Bar Graph (with your own data)
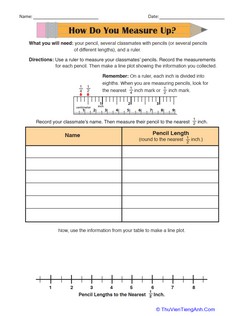
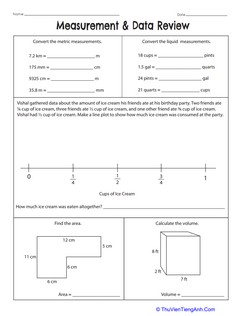
How Do You Measure Up?